

Breaking Down Private-Equity Real Estate Firms
How They Operate & Deliver Value
An educational deep-dive for family offices and institutional LPs
Table of Contents
- Introduction
- 1. The Private-Equity Real Estate Playbook
- 2. Spotlight on Value-Add Strategies
- 3. Fundraising Landscape: 2025 PERE 100
- 4. The Mechanics Behind the Magic
- 5. Why Family Offices & LPs Choose Value-Add
- 6. Conclusion & Call to Action
- Q&A: Your Top Questions, Answered
- Executive Summary & Key Takeaways
- Glossary: Speak LP-Fluent
In today’s capital-intensive world, private real estate equity firms have emerged as essential partners for family offices and institutional LPs seeking risk-adjusted returns beyond the public markets. But what exactly makes these firms tick? In this narrative, we’ll unpack their business models, spotlight value-add strategies, and lean on both Preqin and PERE 2025 data to illustrate how top players raise and deploy capital.

1. The Private-Equity Real Estate Playbook
At their core, real-estate private-equity firms raise closed-end, blind-pool equity vehicles that pool LP commitments into dedicated funds. Unlike open-end REITs or funds, these vehicles:
Commit & Call Capital
LPs pledge to the fund; GPs issue capital calls as deals are sourced.
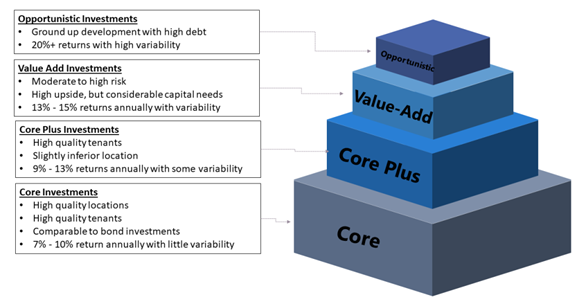
Execute a Defined Strategy
- Core-plus funds target stabilized properties with modest leverage.
- Value-add funds acquire under-managed assets, execute renovations or lease-up plans, and exit at higher valuations.
- Opportunistic funds pursue development projects, complex repositionings, or distressed debt plays—often the riskiest but potentially most rewarding segment.
Harvest Returns
- Distributions occur via property sales or refinancings.
- Funds have finite lives (typically 8–12 years), with extensions at the GP’s discretion.
This closed-end structure creates a “J-curve” effect: early capital calls and fees weigh on net asset value, followed by value creation in years 3–7, and peak distributions toward fund maturity.
The Complete 8-Step Lifecycle
- Fundraise & Commit
LPs (family offices, pensions) pledge capital; GPs assemble a target fund size.
- Capital Calls
GPs draw down capital as deals clear due diligence.
- Strategy Execution
- Core-Plus: Stabilized assets, 50–60% LTV, modest leverage.
- Value-Add: Under-managed assets, renovations, operational overhaul.
- Opportunistic: Ground-up development, complex repositionings, distressed debt.
- Asset Management
On-site or third-party teams implement capex budgets, leasing plans, and cost controls.
- ESG Integration
Green retrofits, community partnerships, energy-efficiency upgrades.
- Monitoring & Reporting
Quarterly NAV updates, cash-flow statements, KPI dashboards.
- Exit Planning
Sales to long-term investors or refinances; target 1.5–2.0× equity multiples.
- Distributions & Wind-Down
Returns flow back to LPs per the waterfall; fund terminates after ~10 years.
J-Curve Effect Visualization
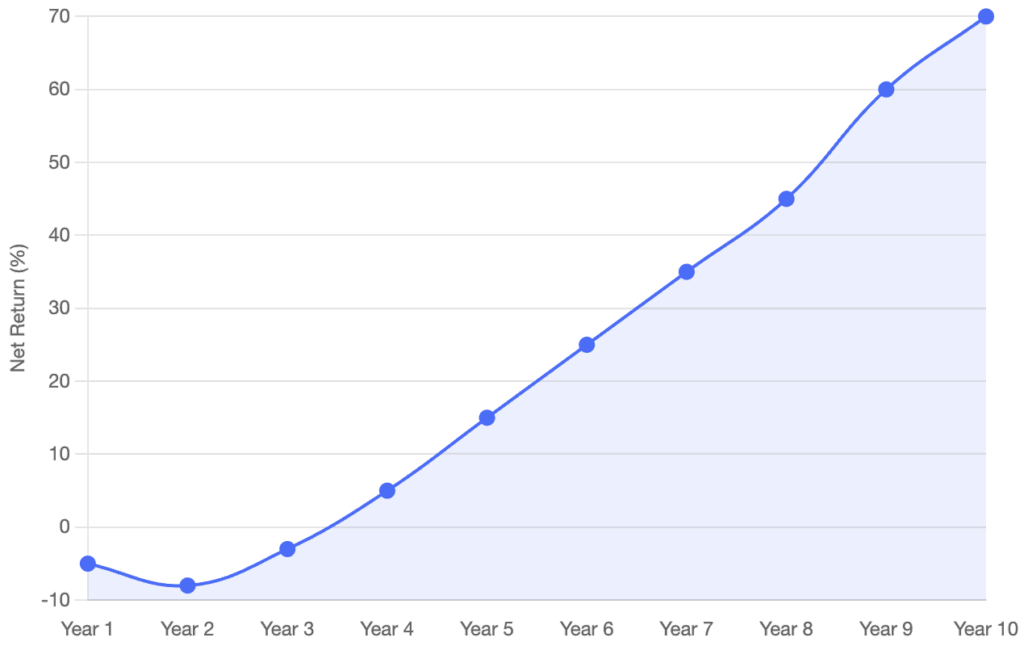
The J-curve illustrates how early fees and expenses typically create negative returns before value creation activities generate positive returns.
2. Spotlight on Value-Add Strategies
For family offices and institutional LPs that crave a balance between risk and return, value-add real estate funds often represent the sweet spot:
- Risk Profile: Moderate—leaner than opportunistic but more aggressive than core-plus.
- Value Drivers:
- Unit renovation/upgrades
- Operational improvements (amenity enhancements, leasing incentives)
- Active asset management (rent optimization, expense controls)
- Market Focus: Sunbelt multifamily, suburban office conversions, urban mixed-use.

Performance Benchmarks (Preqin Pro, Q4 2024)
| Strategy | Median Net IRR (%) | Median TVPI (x) |
|---|---|---|
| Value-Add Real Estate Funds | 8.3 | 1.6 |
| Opportunistic Real Estate | 5.4 | 1.4 |
Value-add’s higher IRR and multiple reflect the payoff of hands-on improvements without the full development risk of opportunistic funds.
Mini Case Study: Sunbelt Multifamily Play
Fund Size: $300M value-add vehicle
Market: Emerging Sunbelt metros
Approach:
- Acquire 1,200 units at 65% LTV
- Invest $15K/unit in interior/exterior upgrades
- Implement dynamic rent-growth model (5% CAGR)
Outcome:
- Hold period: 5 years
- Net IRR: 9.8%
- TVPI: 1.7×
This illustrates how operational alpha and market timing converge to outpace core-plus while avoiding full development risk.
3. Fundraising Landscape: 2025 PERE 100
Even the best strategies require capital. According to PERE’s 2025 ranking of the world’s largest firms (by 2020–24 raises), the closed-end real estate fundraising market totaled $104 billion in 2024 across strategies.
Closed-End Real Estate Fundraising by Strategy (2024)
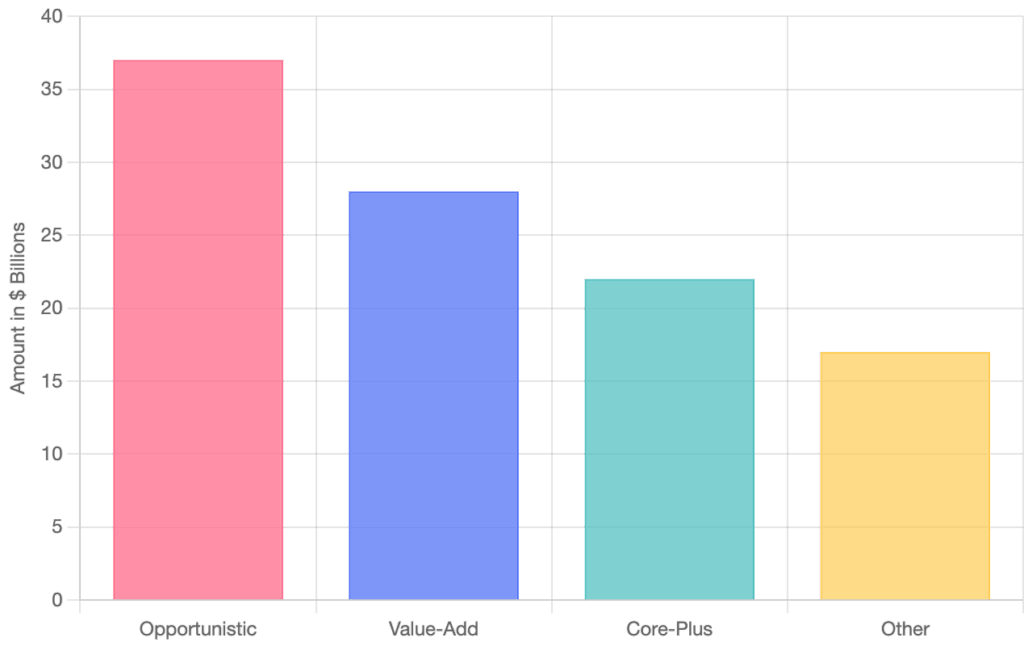
Opportunistic fundraising’s decline (–31.5% vs. 2023) highlights LP caution, whereas value-add and core-plus remained resilient.
Fundraising Mix: 2016–19 vs. 2020–24
| Closed-End Fundraising by Strategy | 2016-19 | 2020-24 | % Change |
|---|---|---|---|
| Opportunistic | $45B | $37B | -18% |
| Value-Add | $32B | $28B | -12.5% |
All figures in $ billions (Preqin, McKinsey). Despite a pullback in opportunistic (–18% vs. prior cycle), value-add remains robust, reflecting LP appetite for balanced risk–reward.
4. The Mechanics Behind the Magic
4.1 Sourcing & Due Diligence
- Local market teams target mis-priced or under-utilized assets.
- Proprietary analytics flag properties ripe for operational uplift.
4.2 Capital Structure & Leverage
- Typical LTV (loan-to-value) for value-add: 60–65%
- Mezzanine or preferred equity can bridge caps on senior debt.
4.3 Asset Management Playbook
- On-site teams or third-party property managers execute renovation timelines and leasing strategies.
- Quarterly asset-level reporting keeps LPs in the loop.
4.4 Exit Execution
- Sale to long-term investors (REITs, pension funds) or refinance strategies capture built-in equity.
- GPs aim for 1.5–2.0× gross equity multiple before fees.
Fee Transparency & Alignment
| Fee Type | Typical Range | Notes |
|---|---|---|
| Management Fee | 1.25–1.75% | On committed capital (years 1–5), then NAV-based |
| Acquisition/Disposition | 0.5–1.0% per event | Incentivizes deal sourcing & exits |
| Asset Management Fee | 0.25–0.5% NAV | Covers ongoing oversight |
| Carried Interest | 18–22% | Back-ended performance share |
| GP Co-Investment | 1–3% of fund size | Ensures skin in the game |
Transparent fee tables build LP trust and highlight alignment: the more the fund succeeds, the more GPs earn.
5. Why Family Offices & LPs Choose Value-Add
Attractive Risk-Return
Historical net IRRs near 8–10% outperform core-plus without full development risk.
Inflation Hedge
Renovated rents can outpace inflation, boosting NOI.
Aligned Incentives
GPs often co-invest ~1–2% of fund equity, tying their upside to LP outcomes.
Operational Alpha
Active management creates value independent of broader market cycles.
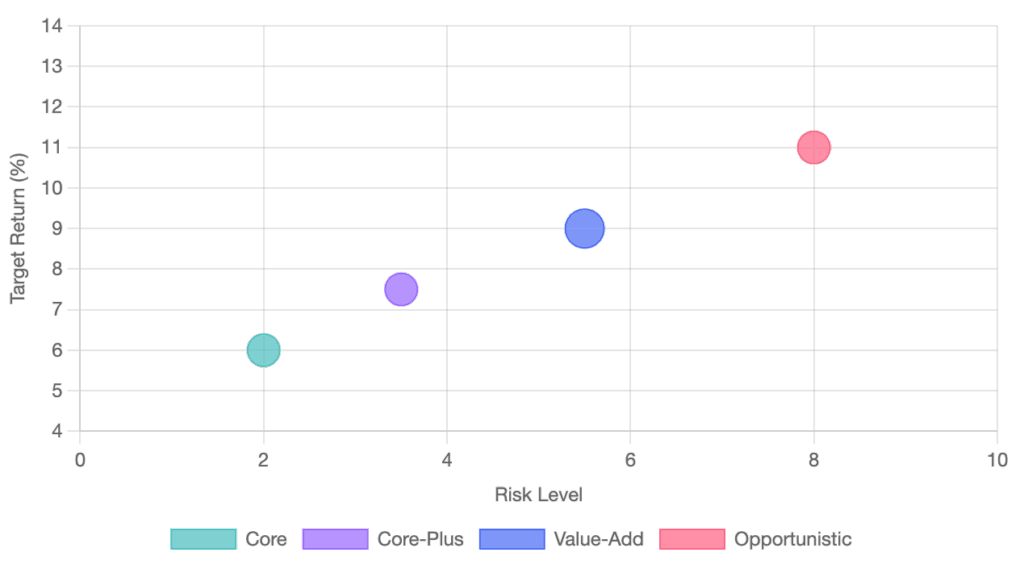
Value-add strategies offer a balanced risk-return profile compared to other real estate investment approaches.
Risk-Return Spectrum
6. Conclusion
Private real estate equity—especially value-add strategies—remains a cornerstone for institutions and family offices seeking diversification, income growth, and real-asset inflation protection. While opportunistic funds still have a place for aggressive return targets, value-add offers compelling middle-ground performance backed by Preqin and PERE data.
Q&A: Your Top Questions, Answered
Q1: What’s the minimum commitment for value-add funds?
A1: Typically $5 million–$10 million for institutional LPs; some family offices syndicate smaller checks via feeder vehicles.
Q2: How long is the typical hold period?
A2: 4–7 years: 2–3 years for repositioning/leasing; 1–2 years for exit execution.
Q3: How do fees compare to other strategies?
A3: Management fees ~1.5% on committed capital, carry ~20%—comparable to opportunistic but higher than core-plus.
Q4: What are key due-diligence metrics?
A4: Underwritten IRR, NOI ramp-up projections, capex budgets, exit cap-rate assumptions, and local rent growth trends.
Q5: How is dry powder managed?
A5: GPs maintain a deal pipeline and deploy dry powder within 18–24 months, reducing uninvested capital drag.
This narrative should arm your family office or LP team with the fundamentals of how private-equity real-estate firms operate, why value-add strategies stand out, and what fundraising trends signal for 2025. Let’s build your next 10% IRR pipeline together.
Executive Summary & Key Takeaways
- 1. Value-Add Wins: Value-add funds deliver median net IRRs of ~8–10% vs. opportunistic’s ~5–7%.
- 2 2024 Fundraising Mix: Opportunistic raised $37B, value-add $28B, core-plus $22B—signaling LPs favor the middle ground.
- 3 5 Questions to Ask Your GP: From underwriting assumptions to ESG integration, make sure your next fund answers these.
Glossary: Speak LP-Fluent
This analysis relies on historical data and projections—actual outcomes may differ. Always consult your legal, tax, and investment advisors before making commitments. Past performance is not indicative of future results.